Totalview includes a full featured memory debugging client called memscape. It may be invoked either from within totalview (Tab Debug select Open MemoryScape) or directly, as I describe here. Just type
memscape or memscape simple3
and see you again at
|
Before we can start debugging we need to pass the command line argument
100.
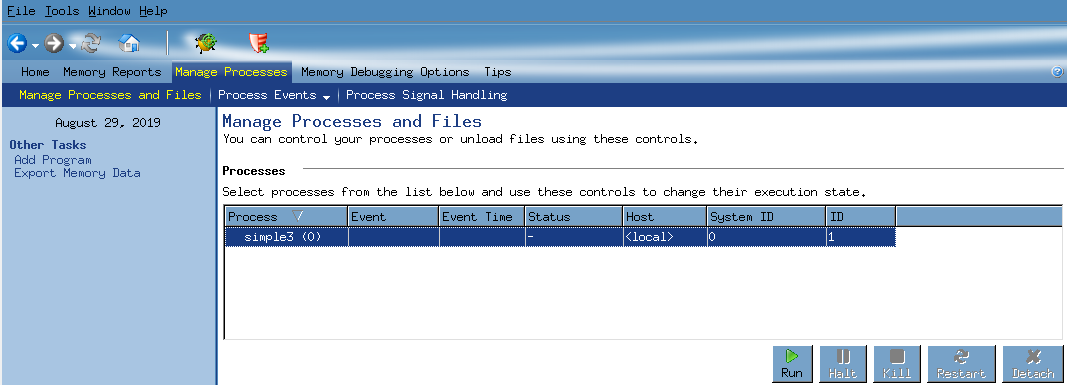
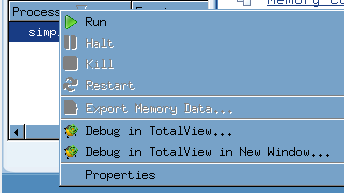
Right click on the executable and select Properties to specify
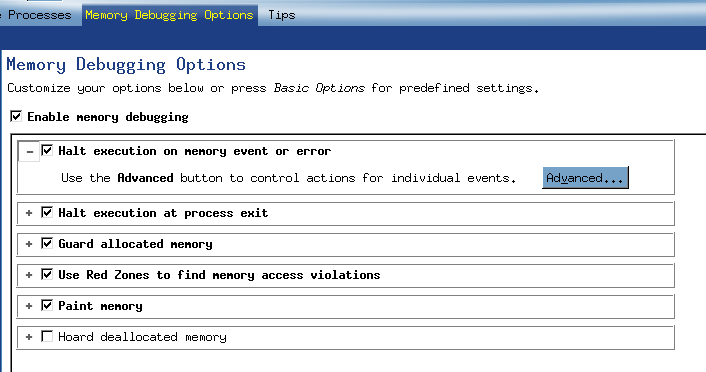
this value. To obtain the most benefit from memscape select some non standard Memory Debugging Options as indicdated. |
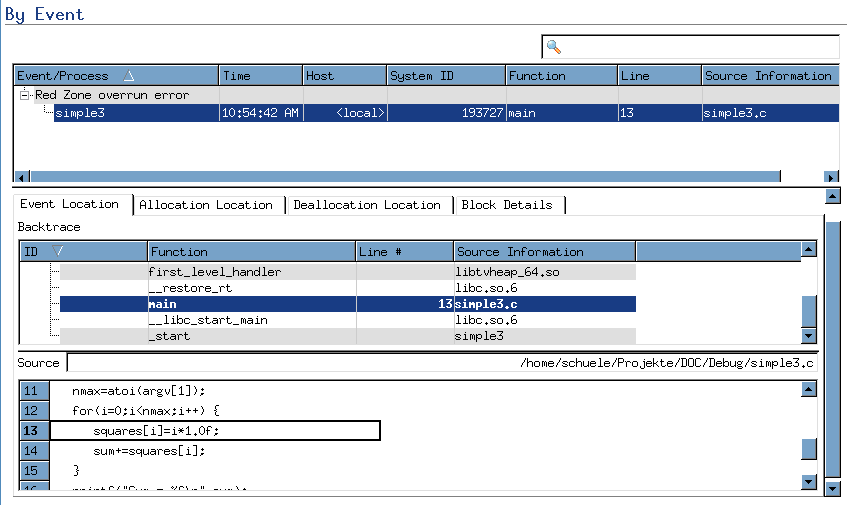
Now you are ready to run the executable and the program stops directly
at the line. In case you do not remember from previous sections, the
code exceeds the allocated size of squares thus overwriting the
variable nmax. With memscape we immediately find the
corresponding place there this is happening.
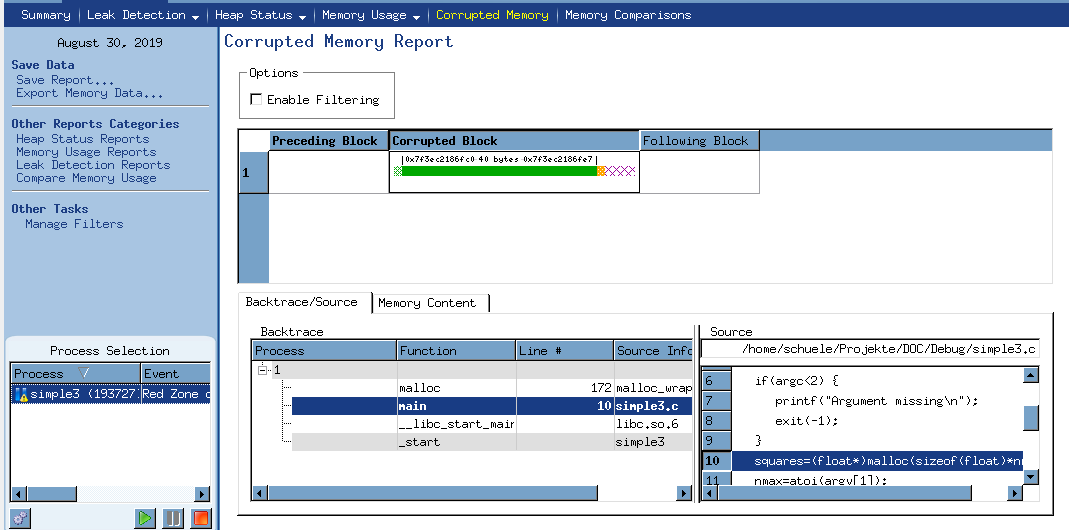
Now we may go back to totalview and start debugging or we may switch to the Corrupted Memory Report. This report has coloured in green the size of squares and in red some of the values we are changing in the code. This way we can easily find out, that we should enlarge the array before continuing to work with our little program.